A practical, no-fluff guide to validating problems, reading early signals, and making the pivot-or-persevere call before the runway disappears.
Most early-stage startups do not fail because they run out of money. They run out of money because they spent it building something nobody urgently needed. That is the product-market fit problem in one sentence, and it is brutally common in resource-constrained teams where the cost of being wrong is not a missed quarter but a closed company.
The challenge is not a shortage of ambition or even ideas. It is the absence of a repeatable process for testing assumptions cheaply, reading user signals honestly, and acting on what the data is actually saying rather than what the team hopes it is saying.
This guide covers five specific, practical disciplines that lean startup methodology puts at the centre of early-stage product development and how to apply each one when time, budget, and headcount are all limited.
1. Problem Validation Frameworks: Do the Work Before a Single Line of Code
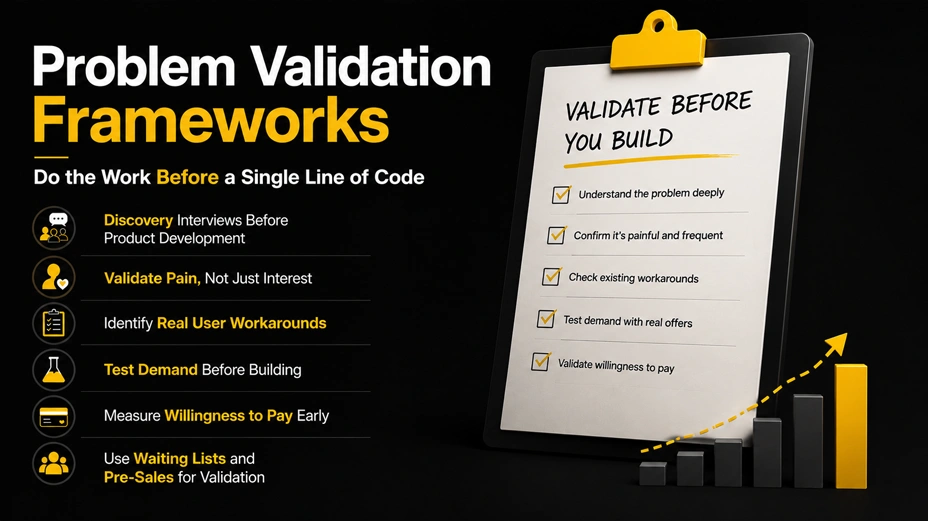
The most expensive mistake in early-stage product development is building a solution to a problem that is not painful enough to pay for. Problem validation frameworks exist to test that assumption before engineering time is committed.
The distinction that matters here is between a problem people acknowledge and a problem people actively want solved. Plenty of founders find the first. Very few confirm the second before building. The gap between them is where most early-stage products die.
A Three-Stage Problem Validation Process
- Discovery interviews — Conduct 20–30 structured conversations with your target user. The goal is not to pitch. It is to map the problem: how often it occurs, what it currently costs them in time or money, and what workarounds they have already tried. Workarounds are the most honest signal. If someone has built a clunky spreadsheet to solve a problem, that problem is real.
- Demand signal testing — Before writing a spec, test whether the problem maps to paying intent. A simple waiting list with a specific value proposition, a direct outreach campaign offering early access for a fixed fee, or a pre-sale of a service you deliver manually — these tests cost days, not weeks, and they produce data that interviews alone cannot.
- Assumption mapping — List every belief the business model depends on. For each assumption, define the minimum evidence that would confirm or disconfirm it. Rank by risk: the assumptions that, if wrong, would invalidate the entire model get tested first. This is the foundation of data-driven decision-making at the product level.
Rule of thumb: If you cannot find 15 people willing to pay for your solution before you build it, you do not have a validated problem. You have a hypothesis. Treat it accordingly.
The cost of skipping problem validation frameworks is not just wasted engineering time. It is the compounding cost of building features on top of a foundation that was never solid — and discovering this 12 months in, when the runway is thin and the options are limited.
2. Landing Page MVP Tests: Converting Curiosity into Paying Customers
A landing page minimum viable product is one of the most misunderstood tools in lean startup methodology. Most teams use it to measure signups. The ones that use it correctly measure something harder and more useful: the conversion from signup to paid commitment.
The benchmark that separates a viable signal from noise is 15%. If your landing page MVP is converting 15% or more of visitors who sign up into paying customers even at a nominal early-adopter price, you have evidence of genuine demand. Below 5%, and the problem or the positioning needs revisiting before you build further. The range in between requires more data before drawing conclusions.
What a Landing Page MVP Test Actually Measures
- Clarity of the value proposition — Does the person understand, in under 10 seconds, what problem this solves and for whom?
- Strength of the pain — Is the problem urgent enough that a stranger will hand over their email, their time, or their money without a product to touch?
- Quality of the target segment — Are the people converting the people you actually want as customers, or are they a different cohort with different needs?
- Willingness to pay at this price point — The only way to test pricing is to charge. A free waitlist tells you about interest. A paid waitlist tells you about demand.
How to Run This Correctly
- Build one page with one specific promise to one specific audience. Broad positioning at this stage produces ambiguous data.
- Drive traffic from a channel that resembles your eventual acquisition strategy — organic search, paid social, direct outreach, or community — not from your personal network alone.
- Include a payment step, even if you refund everyone. Entering card details is a qualitatively different commitment to clicking a button.
- Capture the reason when people do not convert. An exit survey with one question – ‘What stopped you signing up today?’ – generates the most useful customer feedback loops of the entire MVP phase.
The minimum viable product at this stage is not a prototype. It is a testable claim. The landing page is the test. The conversion rate is the result. And the customer feedback loops generated from non-converters are often more valuable than the conversions themselves.
3. Cohort Analysis: Finding Retention Leaks Before They Sink the Business
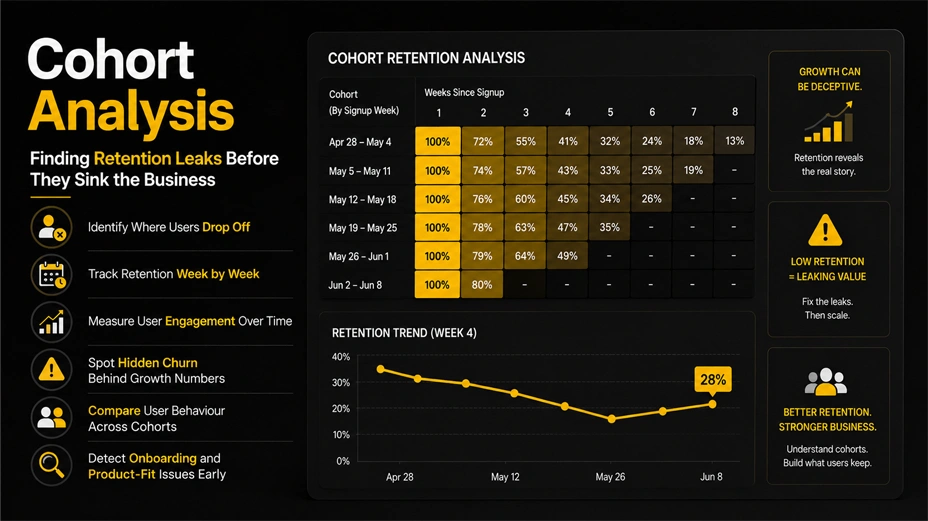
Most early-stage teams track total active users. Cohort analysis tracks something more useful: whether the users who joined in a given week are still active four weeks later, and whether that retention number is improving or declining over time.
This distinction is critical. A product growing at 20% month-on-month can still be haemorrhaging value if week-4 retention is below 10%. Total growth masks the leak. Cohort analysis surfaces it.
The Retention Numbers That Matter
- Week-1 retention (Day 7) — the percentage of new users who return within the first week. A healthy benchmark for B2B SaaS products is 60–70%. Below 40% signals a serious onboarding problem.
- Week-4 retention (Day 28) — the percentage of users still active after one month. For most SaaS products, 25–35% is a viable early signal. Below 15% typically indicates a product-market fit problem, not an onboarding problem.
- Retention curve flattening — the point at which a cohort’s retention stabilises rather than continuing to decline. This flat line represents your retained core: the users for whom the product has genuine, recurring value. If the curve never flattens and continues declining to zero, you do not yet have product-market fit for this cohort.
Practical Cohort Analysis for Small Teams
You do not need a data warehouse or a business intelligence tool to run cohort analysis. A spreadsheet tracking weekly signups and login activity by user cohort produces the same insight. What matters is the discipline of running it weekly, not the sophistication of the tooling.
The customer feedback loops that cohort analysis enables are among the most powerful user retention strategies available at this stage. When a specific cohort, say, users who signed up via a particular acquisition channel or users in a specific job role — shows materially better retention than others, that cohort is telling you something important about where genuine product-market fit exists. That signal should drive everything from feature prioritisation to marketing copy.
Lean startup methodology principle: Retention is the most honest metric in early-stage products. Users vote with their continued engagement, not with their signup. Cohort analysis is how you count those votes correctly.
4. Feature Adoption Heatmaps: Reading Your First 100 Users Like a Book
The first 100 users of any product are a data set unlike any that follows. They are self-selected early adopters who have given you disproportionate trust. They will tolerate friction, work around bugs, and still come back if the core value is genuinely there. Feature adoption tracking across this cohort tells you precisely where that value is concentrated and where it is not.
A feature adoption heatmap, in this context, does not have to be a visual tool. It is any systematic view of which features are being used, by whom, at what frequency, and in what sequence. The pattern that emerges is the product-market fit signal translated into behaviour.
What Feature Adoption Tracking Reveals
- The features your most retained users rely on most heavily — these are almost always the core value drivers, even if they are not the features that appear most prominently in marketing.
- The features that are built but unused — these represent engineering capacity spent on assumptions that were not validated. In a resource-constrained team, this is the cost that compounds most painfully.
- The drop-off points in onboarding — where users reach a feature and fail to activate it. These are the moments where the product-market fit gap is most visible at the user level.
How to Instrument This With Limited Resources
- Implement event tracking from day one using a tool like Mixpanel, Amplitude, or even Segment feeding into a basic dashboard. The cost of adding this retroactively, after the first 100 users have passed through, is the permanent loss of that data set.
- Define your ‘activation event’ before launch — the specific action that indicates a user has experienced the core value of the product. For a project management tool, it might be creating and assigning a task. For an analytics tool, it might be generating a first report. This event is your North Star metric for the MVP phase.
- Review feature adoption data weekly, not monthly. At this stage, patterns can shift quickly, and the team needs to be close enough to the data to notice when they do.
- Supplement quantitative adoption data with qualitative sessions. Watch five users navigate the product without guidance. What they struggle with, what they skip, and what delights them is not visible in event data alone.
Feature adoption tracking is not just a product discipline. It is one of the most direct forms of customer feedback loops available. Users tell you what they value by what they use, and they tell you what is missing by where they stop.
5. The Pivot-or-Persevere Framework: Making the Call With 6 Months of Runway
This is the decision most early-stage founders dread and most delay for too long. The pivot-or-persevere framework is not about admitting failure. It is about applying rigour to a decision that, made badly or too late, can end a company that might otherwise have survived.
The standard lean startup methodology guidance on this decision is useful as far as it goes: if your core metrics are not moving in the right direction despite genuine effort, something fundamental needs to change. But the practical question is what ‘the right direction’ actually means with six months of runway and a product that is somewhere between early signal and clear traction.
The Pivot-or-Persevere Checklist
| Signal | Persevere | Pivot |
| Week-4 retention | ≥ 25 % | < 10 % |
| NPS score | ≥ +30 | < 0 |
| Paid conversion | ≥ 15 % of signups | < 5 % |
| Support ticket themes | Bugs / UX polish | Core value confusion |
| Runway remaining | > 6 months | < 3 months + flat growth |
The 6-Month Runway Maths
Six months of runway is the minimum threshold at which a pivot is still a viable option rather than a forced liquidation. The maths is straightforward:
- Calculate your true monthly burn: payroll, infrastructure, tools, and any fixed costs. Not the number you want it to be — the number it actually is.
- Subtract three months. That is the time required to execute a meaningful pivot: Two months to build and one month to test. If the remaining time is less than three months, a pivot is unlikely to produce enough new data before the runway ends.
- If six months remain and the signals in the table above are consistently in the ‘pivot’ column, that is the window. Waiting for one more month of data when the pattern is already clear is one of the most common and most expensive startup decisions.
Startup growth strategies principle: The pivot-or-persevere decision is harder when the team is emotionally attached to the original thesis. The signals in this checklist are designed to make the data louder than the attachment. Use them.
What Pivoting Actually Means
A pivot is not a restart. In lean startup methodology, a pivot means changing one fundamental assumption – the customer segment, the problem being solved, the channel, or the revenue model – while preserving the learning accumulated to date. The team, the code, the relationships, and the hard-won product intuition all carry forward. What changes is the direction.
The pivot-or-persevere framework works best when it is applied on a fixed schedule, typically every six to eight weeks rather than as a response to a crisis. By the time a pivot feels urgent, the decision has usually been delayed by two months already.
Final Thoughts
Product-market fit is not a milestone you reach. It is a signal you learn to read — and the earlier you build the habit of reading it honestly, the less expensive the corrections become.
For resource-constrained teams, the disciplines in this guide are not optional extras to implement once you have more headcount. They are the mechanisms that make limited resources go further: problem validation frameworks that prevent wasted engineering time, landing page MVP tests that confirm demand before a product exists, cohort analysis that catches retention leaks before they become existential, feature adoption tracking that keeps development focused on actual value, and a pivot-or-persevere framework applied regularly enough to leave room for adjustment.
Lean startup methodology does not guarantee product-market fit. Nothing does. What it does is compress the time between a wrong assumption and the discovery that it is wrong — and in a resource-constrained team, that compression is the difference between a correctable mistake and a fatal one.
If your team is working through any of these frameworks and would find a structured conversation useful, reach out at [email protected]