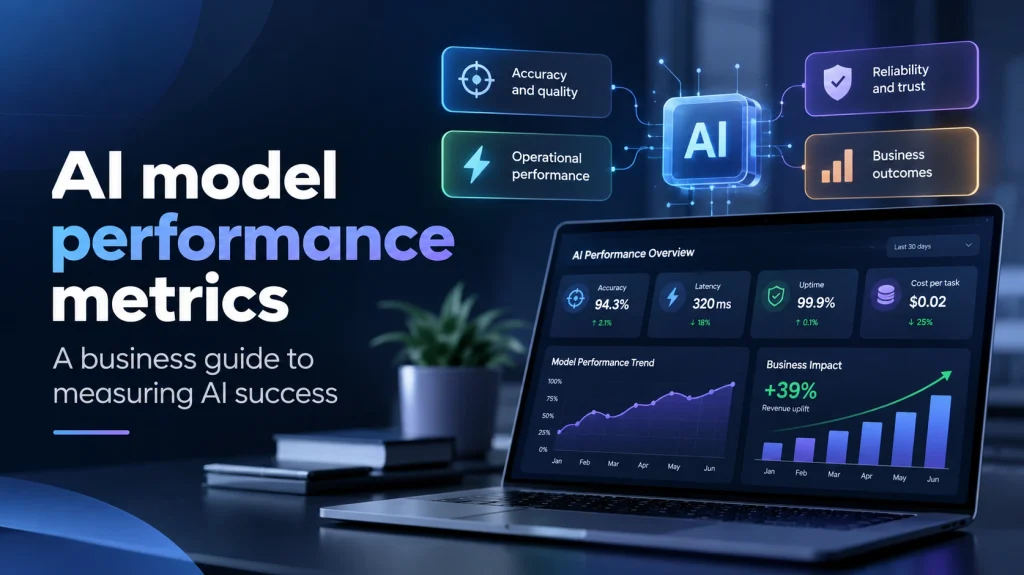
88% of organisations now use AI in at least one business function, yet only 39% attribute any earnings impact to it. The gap is almost always a measurement problem: teams track accuracy benchmarks rather than business outcomes that mean anything to leadership. This guide is for business leaders who need to know which AI model performance metrics actually matter, what each reveals about operational risk, and how to connect technical signals to business value.
AI model performance metrics: what should businesses measure?
Businesses should measure AI model performance across four dimensions: accuracy and quality (is the model right?), operational performance (is it fast and available enough?), reliability and trust (does it behave consistently?), and business outcomes (is it creating value?). No single metric is sufficient. The right combination depends on the use case, the cost of failure, and the regulatory environment.
Key takeaways
- Only 39% of organisations attribute earnings impact to AI; the primary cause is tracking model performance without connecting it to business outcomes
- Accuracy alone is not a business metric: a model can be 95% accurate and still be the wrong tool for the job
- Model drift is the most common silent production failure; surveys report a 3.6% average revenue drag in affected business units
- Hallucination rates reach 18.7% on legal queries even from leading models, making groundedness metrics non-negotiable for generative AI deployments
- Every AI metric should map to a business KPI: latency to customer conversion, precision to compliance cost, drift to revenue exposure
What is AI model performance?
AI model performance is the measure of how well an AI system does what it was built to do across accuracy, speed, cost, reliability, and business alignment. It must be defined before deployment, not after the first production failure. Organisations that define it clearly at the start have a fixed reference point for every model decision that follows; those that do not end up measuring whatever happens to be easy to instrument.
AI model performance vs model accuracy
Accuracy measures the percentage of correct predictions, but a model that is 95% accurate on a balanced test set can perform far worse on the real-world distribution it encounters in production. AI model performance is the broader discipline: accuracy is one signal within it, not a proxy for the whole. The distinction matters most when failure modes are asymmetric: a model predicting loan defaults can be highly accurate on the majority class while nearly useless at catching the defaults that actually matter.
Offline model performance vs production performance
A model evaluated offline sees clean, static data. In production, distributions shift, user behaviour changes, and edge cases arrive daily. Production performance is what matters for business operations; offline evaluation is a starting point, not a destination. The gap between the two is often the biggest surprise in an AI deployment; treating benchmark results as production guarantees is where most post-launch disappointments originate.
Why business context matters
The same model can be a success in one context and a failure in another. A fraud detection model with 90% recall is outstanding for a consumer payments platform and dangerously inadequate for a high-value wire transfer system. Business context defines what “good enough” means for every AI metric. This is why metric thresholds should be set by business stakeholders alongside data science teams, not inherited from academic benchmarks or vendor documentation.
AI model performance metrics at a glance
The table below maps each metric category to the business question it answers and the primary stakeholder responsible for acting on it.
| Metric category | Business question | Primary stakeholder |
| Accuracy and quality | Is the model making correct decisions? | Product, operations |
| Operational performance | Can it handle production load? | Engineering, IT |
| Reliability and trust | Will it behave consistently over time? | Risk, compliance |
| Generative AI quality | Are outputs accurate, grounded, and safe? | Legal, CX, product |
| Business outcomes | Is it creating measurable value? | Leadership, finance |
Accuracy and quality metrics for AI models
Accuracy and quality metrics answer the fundamental question: is the model making the right call? The right metric depends on the cost of being wrong, which varies by use case.
Accuracy
Accuracy is the share of predictions the model gets right; it is useful on balanced datasets but breaks down on imbalanced problems where a model can appear highly accurate while missing most of what actually matters. A model trained on a dataset where 98% of samples are negative can achieve 98% accuracy by predicting negative every time, which is operationally useless. This is why accuracy should never be the only metric on the dashboard.
Precision
Precision measures how often a positive prediction is actually correct; it is the critical metric when false positives are costly, such as fraud flags that block legitimate transactions or alerts that generate unnecessary manual review. Low precision creates operational drag: every false positive consumes analyst time, erodes trust in the system, and can directly harm the customers or processes caught in the crossfire.
Recall
Recall measures how many actual positives the model correctly identifies; it takes priority when false negatives carry the higher cost, such as missed fraud events, undetected medical findings, or security threats that pass undetected. In high-stakes domains, improving recall even marginally translates into significant risk reduction; a 5% improvement on a fraud detection model catching 0M annually recovers 00K in otherwise missed losses.
F1 score
The F1 score is the harmonic mean of precision and recall, balancing both error types in a single number; it is the right metric when neither false positives nor false negatives can be deprioritised. It is particularly useful for communicating model quality to non-technical stakeholders because it reduces a two-dimensional trade-off into a single, comparable figure.
Task-specific quality metrics
Document extraction uses field-level precision; recommendation systems use click-through rate and coverage; summarisation uses BLEU and ROUGE scores; always define quality in the terms of the task, not the algorithm. Choosing the wrong evaluation metric is one of the most common ways AI projects pass internal testing and fail in production; the metric should reflect what users actually experience, not what the model finds easiest to optimise.
AI model operational performance metrics

A model that is accurate but too slow, unavailable under peak load, or prohibitively expensive to run cannot function as a viable business asset; operational metrics determine whether it can perform at the scale and speed the organisation requires.
Latency
Latency is the time between a request and a response; response time degradation above 200ms measurably reduces engagement and conversion in customer-facing AI, making latency a revenue-adjacent metric, not just a technical one. Teams often discover latency problems only under peak load; testing at two to three times expected peak traffic before any customer-facing launch reveals the tail latency numbers that actually define the worst user experience.
Throughput
Throughput measures requests handled per unit of time; a model that performs well at low concurrency may degrade significantly under production load, so throughput must be validated at peak conditions before sign-off. Load testing with realistic traffic profiles, not theoretical maximums, is the practical starting point; if your model handles 100 requests per second cleanly but your peak is 800, the failure mode is predictable and avoidable.
Availability
Availability is the percentage of time the model is operational; for AI in critical business processes, availability targets should match the systems it integrates with, typically 99.9% or above. For AI embedded in a workflow that processes hundreds of transactions per hour, a few minutes of downtime can generate a backlog that takes hours to clear; availability is a business continuity metric as much as a technical one.
Cost per inference
A model running 10 million inferences per day at $0.001 per inference costs $3.65 million annually; it belongs on every AI business case from the first sprint. As usage scales, even marginal differences in cost per inference compound into material budget variances; a reduction from $0.001 to $0.0008 on that same volume saves $730,000 annually, which typically justifies the engineering effort to get there.
Performance per dollar
Performance per dollar normalises quality against cost, enabling fair comparison between models at different price points and making model selection decisions legible to finance. This metric often reveals that a mid-tier model with fine-tuning outperforms a frontier model on a specific task at one-third the cost; model selection based solely on benchmark rankings frequently overlooks this trade-off.
AI reliability and trust metrics
A model that works well today but behaves unpredictably next quarter is a liability; reliability and trust metrics measure whether it can be depended on over time, across changing conditions, and in contexts where stakeholders need to understand and challenge its decisions.
Robustness
Robustness measures how well performance holds up when inputs deviate from training distribution; a model with brittle robustness will quietly degrade the moment real-world conditions diverge from the controlled environment it was built in. Common causes include seasonal data shifts, new product launches, and changes to upstream data sources; stress-testing models against these scenarios before deployment is a routine precaution that most teams skip until the first incident.
Model drift
Model drift occurs when the relationship between inputs and outputs shifts as data evolves; surveys report 78% of executives who experienced drift saw significant business impact, averaging a 3.6% revenue drag in affected business units. Drift rarely announces itself; it typically surfaces as a gradual decline in a downstream business KPI, misattributed to marketing or market conditions, until someone traces it back to the model.
Bias and fairness
Bias metrics measure whether error rates are distributed evenly across demographic groups; undetected bias creates regulatory exposure under the EU AI Act and operational inequity that damages customers and brand reputation. Bias audits should be scheduled before launch and at regular intervals thereafter, not only when a complaint surfaces; by that point the reputational and legal cost is already accumulating.
Explainability
Explainability measures how interpretable a model’s decisions are to the people who act on them; for credit, medical, and hiring decisions, it is a regulatory requirement and a prerequisite for meaningful human oversight. Beyond compliance, explainability has operational value: teams that can trace a model’s reasoning identify errors faster, communicate limitations clearly to users, and build the internal trust that sustains AI adoption long-term.
Consistency
Consistency measures whether the model produces equivalent outputs for equivalent inputs across runs and deployments; inconsistency often signals infrastructure instability or prompt sensitivity and erodes user trust faster than most other failure modes. For LLM-based products, temperature settings and prompt caching configurations are common culprits; even small output variations frustrate users who expect the system to behave predictably.
Safety and guardrail adherence
Safety metrics measure the rate at which the model produces harmful or non-compliant outputs; guardrail adherence tracks how often the policy layer intercepts those outputs before they reach the user. Both metrics should be monitored continuously, not just at launch; adversarial inputs evolve, and a guardrail that catches 99% of harmful outputs today may perform differently as users learn the system’s edges.
Generative AI and LLM performance metrics
Large language models require a distinct metric set because their outputs are probabilistic, open-ended, and difficult to evaluate automatically; these metrics are non-negotiable for any business deploying LLMs in production.
Response quality
Response quality is assessed through human evaluation, LLM-as-judge scoring, and task-specific benchmarks; automated scoring enables continuous monitoring at production scale, while human evaluation remains the gold standard for nuanced outputs. A practical starting point is a golden dataset of 50 to 100 representative queries with annotated ideal answers; even a small, well-curated evaluation set catches the majority of meaningful quality regressions before they reach users.
Groundedness
Groundedness measures how consistently the model anchors outputs in source data rather than training memory; low groundedness is the primary driver of business risk in RAG deployments. In a customer support context, an ungrounded response citing a policy that no longer exists creates a support escalation and legal exposure at the same moment; groundedness is not a quality-of-life metric, it is a risk metric.
Hallucination rate
Even leading models hallucinate at 18.7% on legal queries and 15.6% on medical queries; hallucination rate is a mandatory pre-production threshold for any high-stakes generative AI deployment. The acceptable threshold depends entirely on the use case: a creative writing assistant has a different tolerance than a clinical documentation tool, and conflating the two is where most enterprise AI risk frameworks break down.
Retrieval quality
For RAG systems, retrieval quality measures how accurately the retrieval layer surfaces relevant documents; poor retrieval degrades answer quality even when the model itself is correct, making it a distinct measurement target. The two primary retrieval metrics are precision (are the retrieved documents relevant?) and recall (are all relevant documents retrieved?); improving retrieval quality often produces larger quality gains than upgrading the generation model.
Tool-calling success rate
In agentic AI systems, tool-calling success rate measures the percentage of tool invocations that return usable results; tool failures cascade through the reasoning loop and drive a significant share of production failures. A success rate below 90% on any individual tool call quickly becomes unacceptable in multi-step agent workflows, where each step compounds the error rate; instrument every tool call separately, not as an aggregate.
Token usage and cost
Token usage directly determines inference cost; unexpected increases often signal prompt changes, model updates, or retrieval issues and are the first measurable indicator of a cost problem before it reaches billing. Setting weekly token budget alerts and tracking usage per feature or workflow makes cost attribution practical; without this granularity, AI infrastructure spend becomes a line item that leadership cannot interrogate or optimise.
How AI model metrics translate into business outcomes
Technical metrics have value only when connected to business outcomes; the table below maps each metric category to its business impact and makes the connection legible to leadership.
| Technical metric | Business outcome | Example impact |
| Precision | Compliance cost | Fewer false-positive flags reduce analyst review hours |
| Recall | Risk exposure | Higher recall in screening reduces missed events |
| Latency | Customer conversion | Sub-200ms responses improve checkout completion |
| Drift rate | Revenue stability | Undetected drift costs 3.6% of business unit revenue |
| Hallucination rate | Regulatory risk | Fabricated advice creates legal liability |
| Cost per inference | Margin | Unmanaged inference costs erode ROI at scale |
Revenue impact
Precision and recall move revenue in fraud detection, recommendation, and lead scoring; a one-point improvement in a sales qualification model is a calculable change in pipeline conversion. Building a model-to-revenue linkage at the start of an AI project, even a rough one, gives leadership a concrete basis for evaluating investment and a target to hold the team accountable to.
Cost reduction
Latency, throughput, and cost per inference determine whether AI delivers projected savings; a model that cuts processing time by 60% but triples infrastructure spend may not achieve net savings. Cost modelling should happen before model selection, not after the architecture is locked; the choice between a hosted API and a self-hosted model often hinges entirely on inference volume and the unit economics at scale.
Customer experience
Response quality, latency, consistency, and hallucination rate govern customer experience directly; users feel speed, accuracy, and reliability in every interaction. Customer experience metrics like CSAT, NPS, and resolution rate sit above the technical AI layer; tracking both in the same dashboard makes the relationship between model health and user satisfaction visible rather than assumed.
Operational efficiency
Throughput, availability, and cost per inference determine whether the AI system can support the operational volume it was built for; gaps here are what turns successful pilots into failed deployments. Capacity planning should also account for growth; a model that handles current volume comfortably may require a full infrastructure re-architecture at two times scale if throughput and cost constraints were not designed in from the start.
Risk and compliance
Bias, explainability, safety adherence, and drift determine regulatory exposure; for credit, hiring, or healthcare AI, each metric requires a named owner and a defined review cadence before go-live. Organisations that treat compliance metrics as a launch checklist rather than an ongoing programme are systematically exposed; the EU AI Act and NIST AI RMF both require continuous monitoring, not point-in-time assessments.
Which AI metrics matter most by industry?
Every industry prioritises a different metric mix based on regulatory exposure, customer impact, and the cost of failure in its specific context.
Financial services
Precision, recall, explainability, and drift monitoring are critical; fraud detection demands high recall, credit decisions require explainability for compliance, and drift monitoring is mandatory as financial data distributions shift with economic cycles. Financial regulators increasingly require model documentation and audit trails, which means explainability and version history are compliance infrastructure, not optional engineering polish.
Healthcare
Recall, robustness, and hallucination rate take priority; a missed positive in clinical decision support carries life-safety risk, and hallucination rate must be near zero for any model informing clinical judgment. Healthcare AI also requires performance documentation across demographic subgroups; a model that works well on the majority population but underperforms on specific patient groups creates liability and patient safety risk at the same time.
Retail and e-commerce
Latency, recommendation quality, and cost per inference dominate; conversion depends on response speed and recommendation accuracy, while inference costs scale directly with catalogue size and traffic volume. Seasonal spikes such as Black Friday and major sales events are the highest-risk moments for retail AI; load testing and cost modelling for peak traffic should be standard pre-launch practice, not a post-incident action item.
Customer service
Response quality, consistency, and hallucination rate define performance; an assistant that gives fabricated or inconsistent answers damages trust faster than a slow but accurate one. Escalation rate is a useful proxy business metric here: if a high share of AI-handled queries still require human intervention, the model’s effective throughput benefit is much lower than raw accuracy numbers suggest.
Manufacturing
Precision, robustness, and availability are primary; quality control and predictive maintenance systems must perform reliably under variable sensor conditions and cannot tolerate availability gaps in production. Model failures in manufacturing often map directly to line stoppages or defective units reaching downstream processes; the cost of an availability gap or precision failure is measured in production hours, not just engineering escalations.
Recruitment
Bias, explainability, and recall carry the highest legal stakes; biased screening creates employment law exposure, unexplainable decisions make appeals unworkable, and low recall filters out qualified candidates before human review. Several jurisdictions now require pre-deployment audits of AI hiring tools; building bias measurement into the evaluation pipeline before launch is cheaper and less disruptive than remediating it after a regulatory challenge.
How to choose the right AI performance metrics
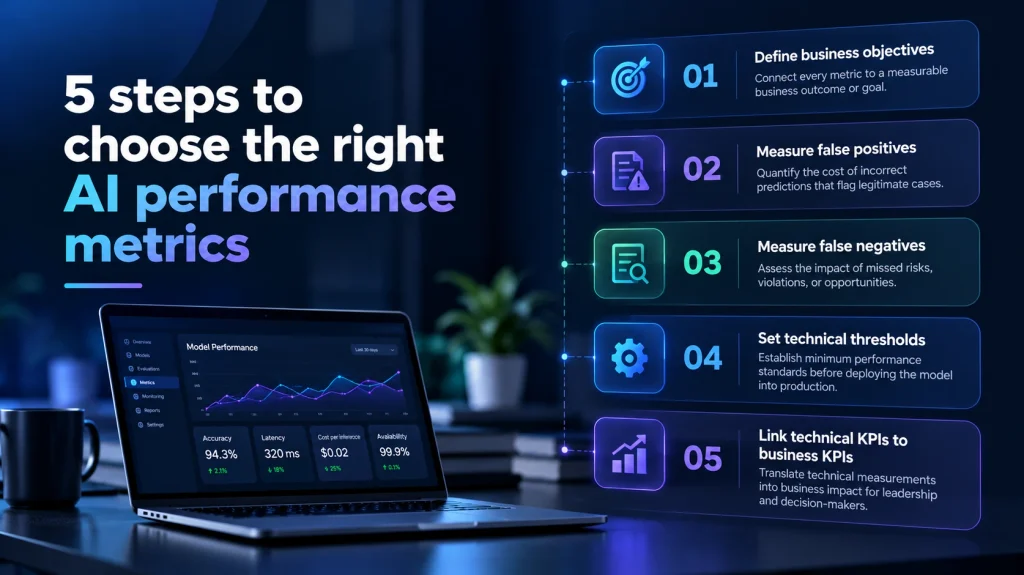
The most common mistake is letting data science teams own the measurement framework without business and compliance input; the right approach starts with the business outcome and works backward to technical signals.
Start with the business objective
Define success in operational terms first: fewer fraud losses, faster document processing, higher conversion, reduced analyst hours; every metric you track should have a direct line to one of these objectives. If a metric cannot be connected to a business outcome in one or two steps, it probably belongs in an internal engineering dashboard rather than a cross-functional performance review.
Define the cost of false positives
Quantify what happens when the model predicts positive incorrectly: blocked legitimate transactions, wasted sales effort, unnecessary escalations; this cost sets the precision floor for the use case. In practice, this is a conversation with operations and finance, not a data science decision; the people who manage the downstream workflow are the ones who can accurately quantify what each false positive actually costs.
Define the cost of false negatives
Quantify what happens when the model misses a true positive: undetected fraud, missed findings, let-through violations; the relative cost determines whether recall or precision takes priority. Where the cost of a false negative is genuinely catastrophic, such as a missed clinical finding or an undetected security breach, accepting a much lower precision threshold to keep recall as high as possible is the correct trade-off.
Establish technical thresholds
Set minimum acceptable thresholds for every metric before deployment; without them there is no objective basis for deciding when a model needs retraining or replacement. Thresholds should be documented in a model card and reviewed by both technical and business stakeholders; a threshold agreed in advance removes ambiguity when a metric starts trending toward its limit in production.
Connect technical KPIs to business KPIs
Build a metric map connecting technical measurements to business outcomes: precision to compliance cost, latency to conversion, drift to revenue exposure; this makes AI performance legible to leadership. Reviewing this map in leadership reporting, even quarterly, keeps AI performance from being treated as a black box and makes the case for measurement investment when results are strong.
AI model performance monitoring in production
Measuring AI model performance is not a one-time activity; a model that performs well at launch can degrade within weeks as data distributions shift and the world it was trained on diverges from the world it now operates in.
Establish a baseline
Before going live, document model performance on a representative production-like dataset; without this baseline, drift and degradation are invisible. The baseline should cover the full distribution of expected inputs, including edge cases and seasonal variations; one built only on typical inputs will miss the performance gaps that matter most when conditions change.
Continuous monitoring
Instrument the model to capture metrics in real time or on a daily cadence; the gap between a performance anomaly and a customer complaint is where monitoring value is realised. Even a lightweight setup that logs prediction confidence, latency, and error rates provides a meaningful early warning system; teams that invest in monitoring before launch consistently identify and resolve issues faster than those who add it reactively.
Drift detection
Use Population Stability Index, KL divergence, and prediction distribution monitoring to detect when distributions shift beyond acceptable bounds; integrate drift detection into the pipeline, not a quarterly review. Concept drift (the relationship between inputs and outputs changes) and data drift (the inputs themselves change) require different detection approaches; most monitoring frameworks catch data drift early but miss concept drift until a business KPI moves.
Alerts and thresholds
Define alert thresholds before go-live; set warnings at 80% of the acceptable limit and critical alerts at the threshold, routed to a named owner with a defined response time. Alert fatigue is as dangerous as no alerts; threshold calibration matters, and teams should review alert frequency monthly in the first quarter of production to distinguish signal from noise.
Retraining and model updates
Define retraining triggers before deployment: drift threshold breach, KPI degradation, or scheduled cadence; document version history and validate every update against the baseline before promoting to production. Every model update is a deployment risk; shadow testing the new version against live traffic before promoting it is the lowest-risk way to catch regressions introduced during retraining.
AI model evaluation: pre-production vs production
Evaluation before deployment and evaluation in production answer different questions and require different methods. Both are necessary; neither is sufficient alone.
| Evaluation method | When used | What it tests | Limitation |
| Offline evaluation | Pre-production | Quality on held-out data | Static data, no real users |
| Benchmark testing | Pre-production | Performance vs industry standard | May not reflect your use case |
| Shadow testing | Pre-production / launch | Behaviour on live inputs, no impact | Resource-intensive |
| A/B testing | Production | Business KPI impact | Requires sufficient traffic |
| Canary testing | Production rollout | Real-world performance at limited scale | Slower feedback cycle |
Offline evaluation
Offline evaluation validates model quality on a held-out test set and catches obvious failure modes, but reveals nothing about model behaviour on live, shifting data. The held-out test set should be refreshed periodically to reflect evolving data distributions; a test set that is years old against a model trained on recent data will produce optimistic results that do not transfer to production.
Benchmark testing
Benchmark testing compares performance against published standards and aids model selection, but vendor benchmarks reflect curated conditions rather than your data distribution. The practical alternative is to build an internal benchmark on a sample of your own production data; it takes more effort than running a published suite, but the results are actually predictive of production performance.
Shadow testing
Shadow testing runs the model on live inputs without acting on its outputs, giving the most realistic view of gaps between training data and real user behaviour before any production impact. The primary cost is infrastructure; running two model versions in parallel doubles compute for the test period, but the signal quality justifies it for any deployment where failure carries meaningful business or customer risk.
A/B Testing
A/B testing routes a share of live traffic to the new model and measures business outcome against the control; it is the most direct measurement of real impact but requires sufficient volume for statistical validity. A common mistake is calling a test too early; underpowered A/B tests produce directionally misleading results that get acted on as if they were conclusive, creating decisions that unwind when the effect does not hold at full traffic.
Canary testing
Canary testing gradually increases traffic to the new model while monitoring performance at each step; it is the safest rollout strategy for customer-facing or regulated AI. A typical canary schedule moves from 1% to 5% to 20% to 100% with defined dwell times at each stage; the dwell time should be long enough to detect latent issues, particularly for use cases with delayed feedback loops.
How to build an AI performance dashboard
A well-designed AI performance dashboard makes model health legible to both technical and business stakeholders; the five categories below are the minimum viable monitoring stack for any production AI system.
Model quality metrics
Include accuracy, precision, recall, F1, and task-specific quality metrics; display trend lines rather than point-in-time values so degradation surfaces before it becomes a customer or compliance problem. Colour-coded threshold bands against agreed limits make the dashboard actionable for non-technical reviewers without requiring them to interpret raw metric values.
Infrastructure metrics
Track latency (p50, p95, p99), throughput, and availability; p95 and p99 matter more than the median in customer-facing systems, where tail latency defines the worst user experience. Infrastructure dashboards should be reviewed daily during the first month post-launch; patterns that look acceptable in weekly summaries often reveal recurring spikes at daily granularity.
Cost metrics
Monitor cost per inference, total daily spend, and week-on-week cost trend; flag unexpected increases automatically, as they are often the first visible signal of a model or infrastructure issue. An unexplained 20% increase in cost per inference without a corresponding increase in quality or traffic almost always points to a prompt change, retrieval issue, or infrastructure misconfiguration.
Business metrics
Include the KPIs the model was built to move: fraud loss rate, analyst hours saved, conversion rate, document throughput; this tier makes model health legible to leadership. Where possible, attach a monetary value to each KPI so leadership can see AI performance in terms of revenue protected, cost avoided, or time recovered rather than abstract metric values.
Risk metrics
Track bias indicators, drift scores, hallucination rate, and safety adherence; design this panel for compliance and audit audiences from the start. Risk dashboards should include a review log showing when metrics were last assessed and by whom; this creates the audit trail that regulators and internal governance teams will eventually request.
Common AI performance measurement mistakes
Most AI measurement failures are structural, not technical; they result from how the measurement framework was designed, not from model complexity.
Measuring accuracy alone
A fraud detection model can be 99% accurate while missing most actual fraud events if fraud is rare in the dataset; always pair accuracy with precision, recall, or domain-specific quality metrics. This is not a theoretical failure mode; it has happened in production deployments across financial services and healthcare, producing models that passed evaluation but failed operationally from day one.
Ignoring cost
A model running 10 million inferences per day at $0.002 per inference costs $7.3 million annually; cost per inference is a design-stage decision, not an afterthought. API-based models can appear affordable in prototype but become the largest engineering cost at production scale; building cost per inference into the architecture decision avoids the rebuild that often follows when the budget reality hits.
Ignoring drift
A model with no drift monitoring is a model whose performance is unknown after the first month in production; drift is the most common cause of silent AI degradation and is preventable. The organisations most at risk are those that deployed early AI systems, saw strong initial results, and never built monitoring infrastructure because the model appeared to be working; these are the systems where undetected drift accumulates the most damage.
Using vendor benchmarks as business KPIs
Vendor benchmarks measure performance on curated datasets under ideal conditions; useful for model selection but not a substitute for measurement against your own data and requirements. A model that ranks first on a published leaderboard can rank last on your specific task; the only benchmark that matters for a production decision is one built on data that represents your actual use case.
Not defining baselines
Without a defined baseline there is no objective standard for deciding whether a model is performing well or degrading; establish one before deployment and use it as the reference for every future evaluation. The baseline is also what makes the case for model investments: without it, there is no rigorous before-and-after comparison to show leadership when an improvement effort is worth the cost.
Measuring technical metrics without business outcomes
A technical dashboard with no connection to business KPIs is a report leadership cannot act on; every metric should answer a question a business stakeholder cares about. Bridging this gap is usually a facilitation problem, not a technical one; a single working session between data science, product, and finance to map metrics to outcomes is often all it takes to make a monitoring programme business-relevant.
How to improve AI model performance
When performance falls short, the remediation path depends on which layer is failing; most gaps are data, infrastructure, or design problems, not model problems.
Improve data quality
Before retraining, audit training data for label errors, missing values, distribution imbalances, and freshness gaps; these are the most common root causes of unexplained degradation. In most production systems, improving data quality produces larger performance gains than model architecture changes; it is also the intervention most teams underinvest in because it is less visible than model upgrades. For a practical framework, see our guide to data preparation best practices for AI models.
Improve prompt and retrieval design
For LLM-based systems, prompt and retrieval architecture often have more impact on quality than the model itself; systematic prompt testing and retrieval evaluation are high-return improvements before a model upgrade. A structured prompt optimisation process, including a versioned prompt library and an evaluation suite to test changes against, reduces the risk of regressions when prompts are updated and makes the improvement process repeatable.
Optimize model selection
The largest model is rarely the best fit; smaller, fine-tuned models often outperform frontier models on domain-specific tasks at a fraction of the cost, making performance per dollar the right selection criterion. Model selection should also account for latency requirements; a frontier model that produces better output but adds 800ms of response time may be the wrong choice for a customer-facing feature where speed drives engagement.
Optimize inference
Quantisation, batching, response caching, and hardware selection can reduce latency and cost without changing the model; infrastructure optimisation is often the fastest path to operational improvement. Response caching is particularly underutilised; for systems where a meaningful share of queries are semantically similar, caching reduces cost and latency simultaneously with no model changes required.
Fine-tune when necessary
Reserve fine-tuning for use cases where the quality gap is attributable to domain specificity and the team can maintain the fine-tuned version over time. Fine-tuned models require their own evaluation pipelines and retraining cadence; the total cost of ownership is significantly higher than a hosted general-purpose model, and that cost should be included in the business case before the work begins.
Introduce continuous evaluation
Replace point-in-time testing with a continuous evaluation pipeline running automated quality checks on a sample of live outputs daily; this surfaces drift before it becomes a customer or compliance event. Starting small is practical; even sampling 1% of live outputs and running them through an automated scorer creates a real-time quality signal that most teams currently lack entirely.
Conclusion
AI model performance metrics are not a data science concern; they are a business leadership concern. The gap between AI adoption and AI value is almost always a measurement gap. Organisations that track technical metrics without connecting them to business outcomes are running AI programmes they cannot manage. Build your measurement framework around business objectives, set thresholds before you deploy, monitor continuously in production, and make the connection between technical signals and business impact explicit at every level of the organisation. That is how AI for business intelligence becomes a managed, improvable asset rather than an unpredictable cost centre. The teams that do this well do not have more sophisticated models than their peers; they have better discipline around what they measure, who owns each metric, and what happens when thresholds are breached. If you want to go deeper on the governance layer that sits above measurement, our AI risk management framework guide covers audit requirements, ownership structures, and compliance obligations under current regulation.
Need help building and monitoring production AI models?
If you are deploying AI for business operations and want an IT software company that understands measurement as much as model building, our team designs AI performance frameworks that connect technical metrics to the business outcomes that matter.
Talk to our team about your AI measurement and monitoring needs.