
A practical guide to using cohort analysis, feature adoption heatmaps, and MVP testing to find where users drop off and convert more signups into paying subscribers.
There is a particular kind of growth problem that looks healthy on the surface and is quietly catastrophic underneath. The signup numbers are rising. The product is getting attention. The team is busy. And yet, three months in, the active user count is barely moving. New users are arriving through the front door and leaving through the back, fast enough that the net effect is close to zero.
This is a retention problem, and it is more common than most founders want to admit. According to Mixpanel’s 2023 Product Benchmarks report, the average mobile app retains fewer than 5% of users after 30 days, and SaaS products retain an average of 20–30% of users at the same interval. The full benchmark data is available at mixpanel.com/blog/product-benchmarks. What those numbers mean in practice is that most products are losing the majority of their users before those users ever experience the core value the product was built to deliver.
The good news is that retention leaks are detectable. They are visible in the data, if you know which data to look at and how to read it. Cohort analysis is the method that makes retention leaks visible. Feature adoption heatmaps are the tool that locates exactly where in the product the leak is occurring. And MVP testing, applied correctly, is what validates whether a fix actually works before significant engineering time is committed to it.
This guide covers all three, in the sequence that produces the most useful output: identify the leak with cohort analysis, locate it with feature adoption heatmaps, and validate the fix with MVP testing calibrated to the 15% paid conversion benchmark.
Key Takeaways
- Retention leaks are the single most common reason products with healthy signup numbers fail to grow: users arrive but do not stay.
- Cohort analysis separates the signal of genuine retention from the noise of new signup volume, making leaks visible that aggregate metrics hide.
- Feature adoption heatmaps locate the specific product moments where users disengage, turning a retention problem into a specific design or onboarding problem.
- MVP testing is the fastest and cheapest way to validate whether a proposed fix actually changes retention behaviour before committing to a full build.
- The 15% sign-up to subscription conversion benchmark is a practical threshold for distinguishing genuine demand from polite interest.
- Customer retention strategies that are built on behavioural data consistently outperform those built on survey responses or stakeholder assumptions.
1. Why Retention Leaks Hide in Plain Sight
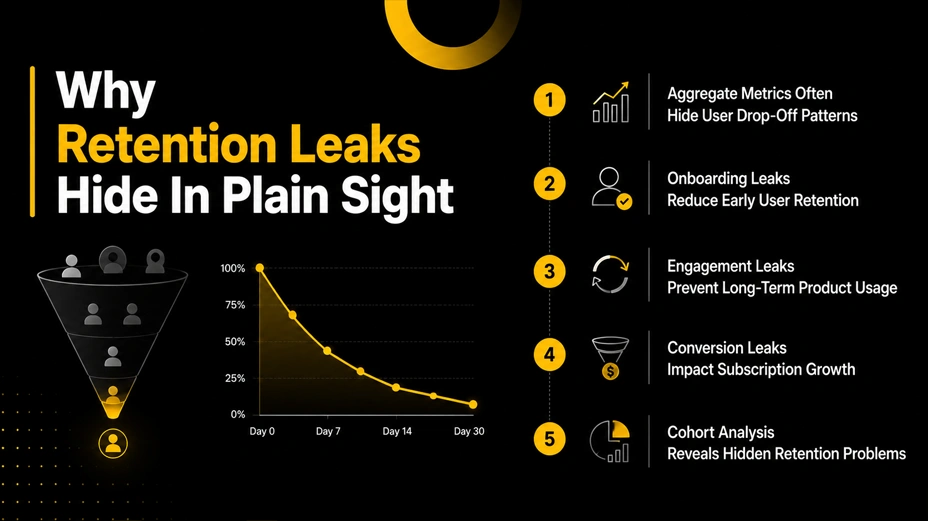
The reason retention leaks are so often missed is that the metrics most teams track are not designed to reveal them. Monthly active users, total signups, and session counts are aggregate metrics: they show the total across all users at a given moment, but they do not show what is happening to any particular group of users over time. A product that is signing up 500 new users per week and losing 450 of them within 30 days will show a steadily growing MAU figure for months before the problem becomes visible in the top-line numbers.
Amplitude’s 2023 State of Product Analytics report found that 60% of product teams still rely primarily on aggregate metrics like DAU and MAU as their primary retention indicators, despite the well-documented limitations of these metrics for identifying user-level behaviour patterns. The full report is at amplitude.com/state-of-product-analytics.
The specific failure modes that aggregate metrics hide are the ones that matter most for early-stage products: users who complete onboarding but never return, users who activate one feature but never discover the features that drive long-term engagement, and users who reach the paywall and abandon rather than convert. Each of these is a distinct retention leak with a distinct cause and a distinct fix. Cohort analysis is the tool that separates them.
The Three Categories of Retention Leaks
- Onboarding leaks: users who sign up, complete the first session, and do not return. The cause is almost always a failure to deliver the core value of the product within the first session. These leaks are visible in the Day 1 retention rate and the activation event completion rate.
- Engagement leaks: users who return for two or three sessions but then stop. The cause is usually a product that delivers initial value but does not create the habit loop or workflow integration that drives regular use. These leaks are visible in the Week 2 and Week 3 cohort retention curves.
- Conversion leaks: users who are engaged with the free product but do not convert to paid. The cause is typically a mismatch between the value the user is experiencing and the value proposition of the paid tier, or friction in the conversion journey itself. These leaks are visible in the sign-up to subscription conversion rate.
Each of these categories requires a different analytical approach, a different fix, and a different MVP test to validate the fix. Treating them all as a single ‘retention problem’ produces interventions that address the symptom rather than the cause.
2. Cohort Analysis: The Method That Makes Retention Leaks Visible
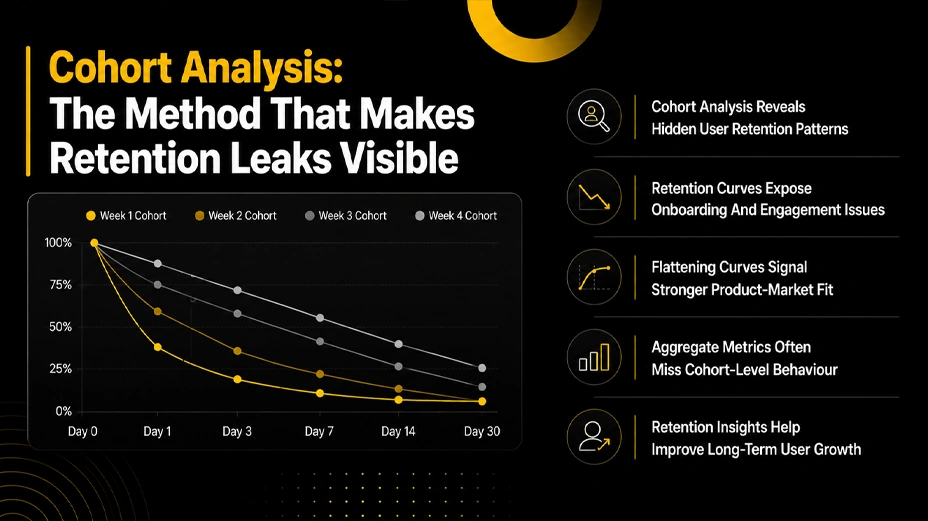
Cohort analysis groups users by a shared characteristic, most commonly the week or month they first signed up, and tracks their behaviour over time as a group. The output is a retention curve: a line that starts at 100% on day zero and shows the percentage of that cohort that returned on each subsequent day, week, or month.
What makes cohort analysis the right tool for identifying retention leaks is that it holds the entry point constant. Every user in a given cohort entered the product under the same conditions: the same week, the same acquisition channel, the same version of the product. When their retention curves differ from the cohort that came in the week before or the week after, the difference points to something specific: a product change, a change in the acquisition channel, a seasonal effect, or an onboarding change. Aggregate metrics cannot produce this level of insight because they blend all of these effects together.
Retention Benchmarks by Product Type
| Product Type | Day 1 Retention | Week 1 Retention | Day 28 Retention | Healthy Curve Signal |
| B2B SaaS | 40–60% | 25–40% | 20–35% | Flattens above 20% |
| Mobile Apps | 25–40% | 10–20% | 5–15% | Flattens above 5% |
| Consumer Web | 30–50% | 15–25% | 8–15% | Flattens above 8% |
| Marketplace / ecom | 20–35% | 10–20% | 5–12% | Flattens above 5% |
| Developer tools | 50–70% | 35–55% | 25–40% | Flattens above 25% |
Reading the Retention Curve Correctly
The retention curve has two features that matter more than the absolute retention numbers at any individual data point: the steepness of the initial drop and whether the curve flattens.
The initial drop from Day 0 to Day 7 tells you about the quality of the first impression. A steep drop in this window indicates an onboarding problem: users are not reaching the point where the product delivers enough value to justify a return visit. This is an improving user onboarding problem, and it is the most common cause of poor Day 1 and Day 7 retention in early-stage products.
Whether the curve flattens is the more important question for long-term retention. A retention curve that continues declining towards zero, however slowly, means the product has not found a core group of users for whom it provides genuine, recurring value. A curve that flattens, even at a low percentage, means the product has found its retained core, and the growth problem is expanding that core rather than fixing a fundamental value problem.
Cohort analysis principle: A product whose retention curve never flattens does not yet have product-market fit for any cohort. A product whose curve flattens at 15% has genuine product-market fit for 15% of its users. The question to pursue is why 85% leave and whether the answer lies in acquisition, onboarding, or the product itself.
Running Cohort Analysis Without a Data Team
A spreadsheet with three columns: user identifier, signup date, and most recent active date, is sufficient to run basic cohort analysis. Group users by signup week, calculate the percentage active in each subsequent week, and plot the resulting curves. The pattern is the same as what a sophisticated analytics platform would show. For teams already using a product analytics tool, Mixpanel, Amplitude, and PostHog all include cohort analysis features that produce the same output with less manual work. PostHog, notably, is open source and free to self-host, making it a practical option for startups managing budgets carefully.
3. Feature Adoption Heatmaps: Locating the Leak in the Product
Cohort analysis tells you that users are leaving. Feature adoption heatmaps tell you where in the product they are leaving and which features they never reached. The combination of the two is what turns a retention problem into a specific, actionable design or onboarding problem.
A feature adoption heatmap, in this context, is a visualisation of which features are being used, by how many users, at what frequency, and in what sequence. It does not have to be a literal heatmap visual; it is any structured view of feature-level engagement data that makes the adoption pattern visible across the user base.
What Feature Adoption Heatmaps Reveal
The patterns that feature adoption heatmaps surfacing consistently across products are the following:
- The features used most by retained users versus churned users: these are almost never the same features. The gap between them identifies the core value drivers that churned users never reached. This is where improving user onboarding should be focused.
- The features built but largely unused: these represent engineering investment placed in the wrong priority. In an early-stage product, unused features are not a minor inefficiency. They are a signal that the assumptions behind those features were not validated before building.
- The sequence in which users actually navigate the product versus the sequence the team intended: real navigation paths rarely match the designed onboarding flow, and the divergence points are where users get confused or lose momentum.
- The drop-off point in the activation journey: the specific feature or step at which the largest proportion of new users stop progressing. This is the onboarding leak in its most specific, actionable form.
Setting Up Feature Adoption Tracking
The minimum viable instrumentation for feature adoption tracking requires four things:
- Event tracking on every significant user action: not page views, but meaningful interactions. Button clicks, form submissions, feature entry points, and completion events for multi-step flows.
- A defined activation event: the single action that best represents a user experiencing the core value of the product. For a project management tool, this might be creating and assigning a task. For a reporting tool, it might be generating and sharing a first report. Everything else in the adoption analysis is measured relative to this event.
- User-level data, not session-level: the analysis requires tracking which specific user performed which actions, not just how many total actions were performed in a session. Anonymous session data cannot produce a feature adoption heatmap.
- A retention cohort linked to feature usage: the most valuable analysis combines the cohort retention curve with feature adoption data. Users who adopted Feature A within their first session: what is their Day 28 retention? Users who did not: what is theirs? The difference is the retention value of that feature.
Tools that support this level of instrumentation without requiring a dedicated data engineer include Mixpanel, Amplitude, PostHog, and Heap. Heap’s autocapture feature is particularly useful for early-stage products because it captures all interactions automatically, without requiring the team to define event schemas before launch.
User engagement metrics principle: The first 100 users are the most valuable data set your product will ever have. They are self-selected early adopters with unusually high tolerance for friction. What they cannot be bothered to do is a very clear signal of what the product is failing to make easy enough.
4. MVP Testing: Validating the Fix Before Building It
Once cohort analysis has identified a retention leak and feature adoption heatmaps have located it in the product, the next step is not to build the fix. It is to test whether the proposed fix actually changes user behaviour, using the smallest possible intervention that can produce a reliable signal. This is MVP testing applied to retention improvement, and it is significantly faster and cheaper than building a complete solution before knowing if it works.
The specific context for MVP testing in retention work is conversion: specifically, the benchmark of converting 15% of signups to paying users. This figure comes from the reality that most products with genuine product-market fit achieve paid conversion rates in the 10 to 20% range from engaged free users, and 15% is a defensible midpoint that distinguishes genuine demand from polite interest.
According to OpenView’s 2023 SaaS benchmarks report, the median free-to-paid conversion rate for product-led growth SaaS companies is approximately 5 to 7% across the total free user base, but rises to 15 to 25% among users who have reached the activation event and used the product at least three times.
What this means in practice is that the 15% conversion benchmark is not a measure of the total free user base. It is a measure of the engaged user base, specifically users who have passed the activation event. Users who signed up and never returned are a separate cohort with a separate problem (the onboarding leak), and mixing them into the conversion denominator produces a misleading figure.
The MVP Test That Validates Conversion Fixes
The most direct MVP test for conversion improvement is a structured change to the paywall or upgrade journey, deployed to a defined cohort of activated users, with a clear measurement period and a pre-defined success threshold. The structure that produces the most reliable results is:
- Define the cohort: activated users who have been in the product for at least 7 days without converting. These are the users most likely to respond to a conversion intervention because they have demonstrated genuine engagement.
- Define the intervention: the smallest change that tests the hypothesis. If the hypothesis is that users do not understand the value of the paid tier, the intervention might be a single in-product message highlighting two specific paid features with concrete outcomes. If the hypothesis is that the price is a barrier, the intervention might be a time-limited trial of the paid tier without requiring payment details.
- Define the measurement period: 14 days is typically sufficient for a conversion MVP test in a SaaS context, long enough to capture users who convert with a delay but short enough to produce an actionable result quickly.
- Define the success threshold: a statistically meaningful improvement in the sign-up to subscription conversion rate within the test cohort. With small sample sizes, a 5 percentage point improvement (from 8% to 13%, for example) is a meaningful signal. Statistical significance at small cohort sizes is limited, but directional signals are actionable.
The Full Funnel View: Where Conversion Rate Optimisation Applies
| Funnel Stage | What to Measure | Healthy Benchmark | Leak Signal |
| Landing page visit to signup | Signup conversion rate | 5–15% | Below 3% |
| Signup to activation event | Activation rate (first value hit) | 40–60% | Below 25% |
| Activation to week-1 return | Early retention | 30–50% | Below 20% |
| Week-1 return to paid conversion | Sign-up to subscription conversion | 10–20% | Below 5% |
| Paid to month-2 renewal | Early paid retention | 70–85% | Below 60% |
Conversion rate optimisation applied to retention is not about optimising each stage of the funnel in isolation. It is about identifying which stage has the largest gap between current performance and the benchmark, and directing improvement effort there. A product with a 45% activation rate and a 4% paid conversion rate from activated users has a bigger opportunity in the conversion stage than in the activation stage. A product with a 15% activation rate and a 25% paid conversion rate has the opposite problem.
5. Putting It Together: A Retention Improvement Workflow
The three tools described in this guide, cohort analysis, feature adoption heatmaps, and MVP testing, are most effective when they are used in sequence as a repeating workflow rather than as one-off investigations. The workflow has four stages, and it should run on a regular cadence, typically monthly for early-stage products and quarterly for more mature ones.
The Four-Stage Retention Improvement Cycle
- Measure: run the cohort analysis for the most recent 4 to 6 cohorts. Compare the retention curves. Identify the stage where the steepest drop occurs (Day 1, Day 7, Day 28) and the cohorts whose curves differ most from the baseline. This tells you where the current primary leak is and whether recent product or onboarding changes have improved or worsened it.
- Locate: pull the feature adoption heatmap for the cohort with the worst retention. Identify the features that retained users adopted in their first session and the features that churned users did not reach. Identify the drop-off point in the activation journey. This tells you specifically where in the product the leak is occurring.
- Hypothesise: form a single, specific hypothesis about why users are leaving at that point and what change would reduce the leak. One hypothesis per cycle. Multiple simultaneous experiments produce ambiguous results.
- Test: design the minimum viable change that tests the hypothesis. Deploy it to a defined cohort. Measure the impact on the relevant retention metric over the measurement period. If the signal is positive, build the full solution. If it is not, return to the location step with a revised hypothesis.
This workflow is not glamorous. It does not require a sophisticated analytics stack or a dedicated data science team. It requires the discipline to run it regularly, to form specific hypotheses rather than vague improvement intentions, and to let the data determine what gets built rather than what feels right in a product review meeting.
Customer Retention Strategies That Compound Over Time
The retention improvements that compound most effectively over time are not the ones that fix a single drop-off point. They are the ones that build a product that creates a genuine habit. The distinction matters because a single onboarding fix produces a one-time step change in Day 7 retention. A product that integrates itself into a user’s daily or weekly workflow produces compounding retention improvements across all cohorts, indefinitely.
Behavioral analysis in SaaS consistently shows that the products with the highest long-term retention are the ones that become the system of record for a specific workflow: the place where a specific job gets done, where the data lives, or where the output gets shared. Identifying which workflow your product can credibly own, and designing the onboarding journey to lead users towards that workflow as quickly as possible, is the highest-leverage customer retention strategy available to an early-stage product team.
Final Thoughts
Retention leaks are not a sign that the product is broken. They are a sign that the product has not yet found the friction points that prevent users from reaching the value it is capable of delivering. Cohort analysis locates the leak in time. Feature adoption heatmaps locate it in the product. MVP testing validates the fix before engineering time is committed to it.
The teams that improve retention fastest are not the ones with the most sophisticated analytics infrastructure. They are the ones who run this cycle consistently, form specific hypotheses rather than general improvement intentions, and treat the user engagement metrics as the primary input to every product decision rather than as a report reviewed after the decisions have already been made.
Behavioural analysis in SaaS is not a specialist discipline. It is a habit. And like most good habits, the return compounds over time in ways that are difficult to predict from the first cycle but become obvious by the tenth.
If your team is working through a retention problem and wants to think through the right analytical approach for your product, reach out at coffee@sparkeighteen.com.